
By Orphe Divounguy, Bryce Hill, Suman Chattopadhyay
In the past 30 years, just one U.S. state has adopted a progressive income tax: Connecticut. It made the switch from a flat income tax in 1996, phasing in the progressive income tax over three years.
The results were disastrous. And they should halt, or at least caution, Illinois lawmakers now pushing to do the same. Connecticut’s experience is a warning that switching to a progressive income tax will eventually end in a tax hike on Illinois’ struggling middle class, result in fewer jobs – particularly for those on the margins of the labor force – and increase poverty. It will fail to combat inequality or fix the state’s finances.
While Connecticut lawmakers sold the progressive tax as a way to provide middle-class tax relief and reduce property taxes, neither occurred. Instead, everyday taxpayers have been hit with recurring income and property tax hikes.

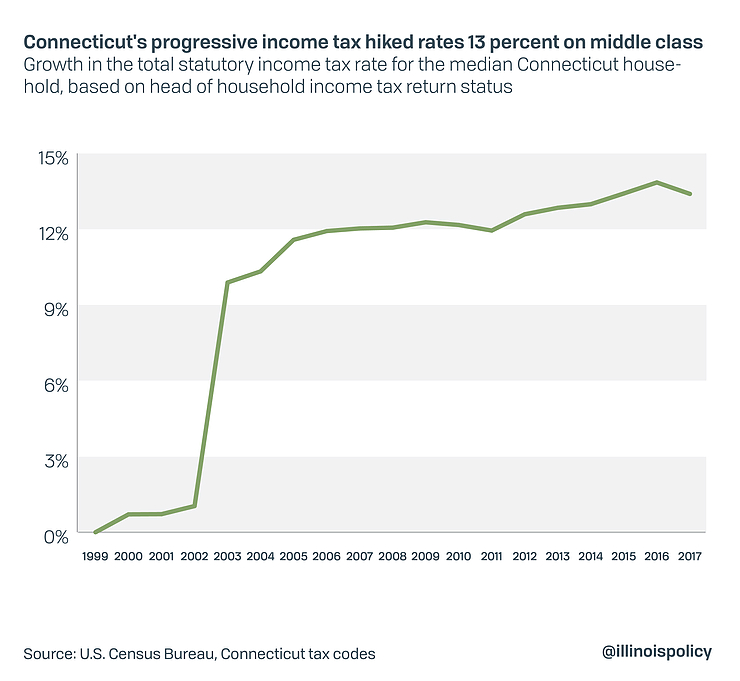
The typical Connecticut household has seen its income tax rates increase more than 13 percent since 1999. At the same time, property tax burdens (property taxes as a share of income) have risen by more than 35 percent. Making matters even worse, the policy change cost the state’s economy more than $10 billion and 360,000 jobs, ultimately shrinking the labor force by an estimated 362,000 workers.
The Connecticut progressive income tax failed to fix state finances. In the wake of its progressive income tax experiment, Connecticut has continually raised taxes on the middle class, has a chronic outmigration problem, and finds itself in a financial situation that is just as dire as Illinois’. Connecticut has run state budget deficits in 12 of the past 15 years, and is holding more debt per capita than almost any other state.
Illinois Gov. J.B. Pritzker’s argument for the progressive tax relies on the same myths – that a progressive income tax will allow for middle-class tax relief and lower property taxes, and shore up the state’s finances. On the contrary, if Illinois ditches its constitutionally protected flat income tax, Illinoisans will face the same fate as Connecticut – higher taxes for everyone, fewer jobs and an even more sluggish economy.
INTRODUCTION
A constitutional amendment filed Jan. 29 by state Sen. Don Harmon, D-Oak Park, would eliminate Illinois’ flat income tax in exchange for a progressive income tax.3 But no one has filed a bill in the current General Assembly telling Illinoisans what the rates would be. Pritzker backed a progressive tax throughout his campaign, but putting the amendment to voters requires its passage by a supermajority in each chamber of the General Assembly; it would not require the governor’s signature.
As state lawmakers consider scrapping the state’s flat income tax, they should look at what happened in the last state to do so.
In the past three decades only one state has adopted a progressive income tax. That state was Connecticut, which first introduced a state income tax in 1991 and introduced a graduated rate structure in 1996.
This report employs the “synthetic control method” as in Abadie and Gardeazabal (2003)4 and investigates the economic impact of the tax changes in Connecticut. A full description of the methodology is included in Appendix A.
WHAT WERE THE EFFECTS OF THE CONNECTICUT TAX HIKES?
Connecticut became the last state to enact an income tax in 1991, introducing a flat 4.5 percent income tax rate. In 1996, the state decided to phase in a progressive income tax featuring tax brackets with a 3 percent tax rate and a 4.5 percent tax rate. This income tax relief was short-lived. In the time since phasing in the income tax, the median household has seen their income tax rates increase by more than 13 percent. Today, Connecticut has seven income tax brackets with marginal income tax rates ranging from 3 to 6.99 percent.
Effects of the tax hikes on real GDP
Connecticut’s decision to enact an income tax had immediate negative effects on the state’s economy, initially costing the state’s economy more than $4 billion, with the economic cost growing to $10 billion following the decision to make the income tax progressive and to gradually raise rates.

The effects of the tax changes are consistent with the expert literature on the subject. Economists widely agree that tax hikes have adverse effects on economic output (see Appendix B). They also agree that progressive tax structures reduce economic growth even more than flat tax structures (see Appendix C). Connecticut’s results provide additional evidence that tax increases are highly contractionary.
Effects of the tax hikes on the labor market
Connecticut’s tax changes had similar effects for workers. The tax increase initially cost the state nearly 233,000 jobs and worsened after the switch to a progressive income tax, with the state losing a total of 362,000 jobs.

While the progressive income tax is often touted as a way to achieve more equal economic outcomes, employment losses hurt everyone. Job losses after Connecticut’s switch to a progressive tax were primarily concentrated among higher-paying jobs, meaning that jobs that allow individuals to move up the income ladder were either destroyed or never created.
This is a typical experience for states with progressive income taxes. These states tend to have persistently higher income inequality, with the gap between the rich and the poor often growing faster than states with flat or no income taxes.
These outcomes show why the academic literature remains divided as to whether progressive income taxation reduces inequality (see Appendix D).
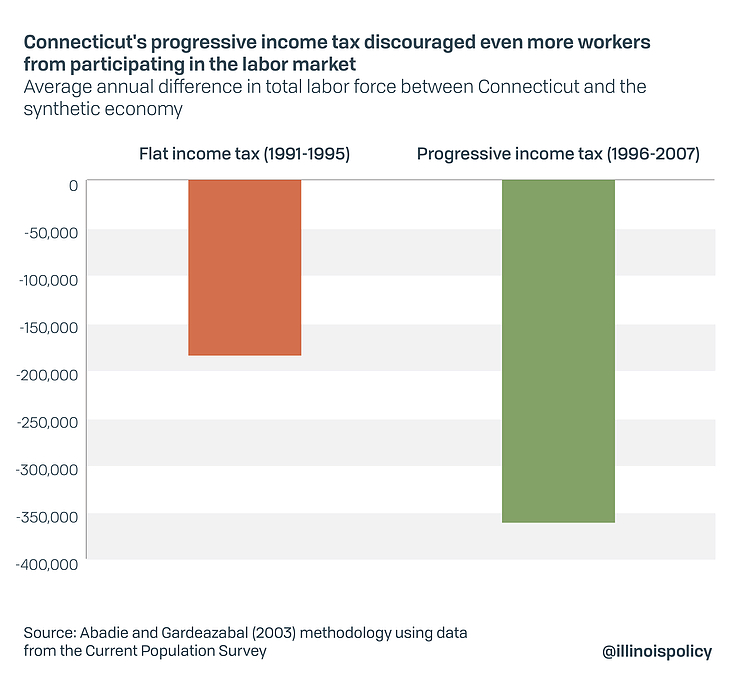
The initial passage of the flat income tax reduced Connecticut’s labor force by nearly 186,000 individuals. In the time since the income tax became progressive, the job market shrank by 362,000.
The large declines in the labor force and employment that followed the tax increase aren’t surprising. Blundell (2014) finds that labor force participation, employment and hours worked respond to tax incentives, especially at early and late stages of an individual’s work life.
Effects of the tax hike on poverty
When compared to the rest of the nation, Connecticut has historically been a wealthy state with fewer of its residents falling below the official poverty line. However, following the introduction of an income tax, poverty rates in Connecticut began to increase while falling in other states.7 From 1980 to 1991, before the introduction of the income tax, Connecticut had a poverty rate of 5.5 percent. That rate had soared to 8.1 percent in the period after the progressive income tax was implemented, from 1996 to 2007.
With fewer jobs available and an increased tax burden, more residents found themselves below the poverty line than before the state began raising its income tax.
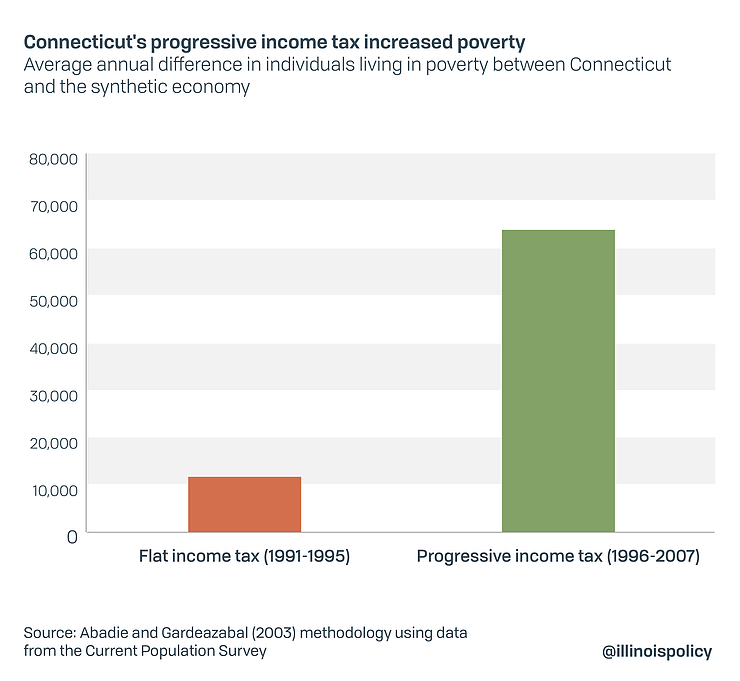
After the flat income tax was enacted, 12,000 more Connecticut residents found themselves living in poverty. After the tax became progressive the problem worsened, with 64,000 individuals falling below the line.
Despite the tax being touted as a tool to combat poverty and help struggling citizens, the policy made matters worse for the most vulnerable. As noted above, while the academic literature is divided as to whether the progressive tax reduces inequality (see Appendix D), in Connecticut, it did not provide relief to lower-income residents and actually increased poverty.
Did progressive income tax hikes stabilize Connecticut’s budget?
Connecticut’s progressive income tax hasn’t done anything to alleviate the state’s dire fiscal condition. The state has run budget deficits in 12 of the past 15 years and has more debt per capita than any other state. The state is also plagued by persistent population decline driven by domestic outmigration in recent years.
Lack of structural reforms to the state’s budget has led to years of middle-class tax hikes.
A BETTER PATH FORWARD
Rejecting a progressive income tax would spare everyone from Connecticut’s sorry fate. Changes to the state tax code will not fix the structural flaws with the state’s finances or reform the main cost-drivers, pensions and government employee healthcare costs. Those two items have led state spending to increase 48 percent faster than Illinoisans’ personal incomes in the past decade.
So long as state expenditures continue to outpace the growth in the state’s economy, citizens will be forced to endure tax hikes regardless of the structure of the state income tax. A progressive income tax will only make it easier for politicians to gradually raise middle-class taxes, as in Connecticut.
A progressive tax is a bad deal. They would be giving up constitutional protections for an illusory promise from lawmakers to lower taxes for some. But a look at history and the outcomes of progressive tax states show that promise is unlikely to be kept. Any progressive tax rates will almost certainly rise to the level of spending – and that means tax hikes on the middle class.
Families and the state’s economy simply can’t afford more tax hikes. That is why lawmakers should limit growth in spending to the growth in economy – to what taxpayers can afford.
ENDNOTES
- R. Pinho, “Connecticut Income Tax Rates and Brackets Since 1991,” Connecticut Office of Legislative Research, 2018.
- American Legislative Exchange Council, “State Bonded Obligations, 2018.”
- Senate Joint Resolution Constitutional Amendment 0001
- Alberto Abadie and Javier Gardeazabal, “The economic costs of conflict: A case study of the Basque Country,” American Economic Review, 2003, 93(1): 113-132.
- Christina D. Romer and David H. Romer, “The Macroeconomic Effects of Tax Changes: Estimates Based on a New Measure of Fiscal Shocks,” American Economic Review, 2010, 100 (3): 763-801.
- R. Blundell, “How responsive is the labor market to tax policy?” IZA World of Labor, 2014, 2 doi: 10.15185/izawol.2.
- Sarah Flood, Miriam King, Renae Rodgers, Steven Ruggles, and J. Robert Warren, “Integrated Public Use Microdata Series,” Current Population Survey: Version 6.0 [dataset], Minneapolis, MN: IPUMS, 2018.
- The official measure of poverty was established by the Office of Management and Budget in Statistical Policy Directive 14, and estimates are taken directly from the Current Population Survey, Annual Social and Economic Supplement.
- American Legislative Exchange Council, “State Bonded Obligations, 2018.”
- Every year since 1959, the U.S. Census Bureau has produced official poverty estimates using the Current Population Survey Annual Social and Economic Supplement. Using individual characteristics from the same data (representative samples from 1980 to 2007), a logistic regression is used to assess which individual observable characteristics are good predictors of poverty status. In Illinois, non-metro area residents have a 3.3. percentage point increase in the likelihood of falling below the poverty line. Residents with no college degree have an 8.2 percentage point increase in the likelihood of falling below the poverty line. And non-white residents have a 10.4 percentage point increase of falling below the poverty line.